

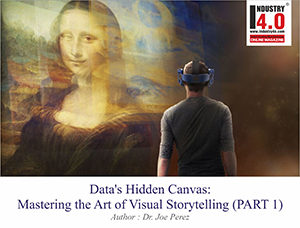
Data’s Hidden Canvas: Mastering the Art of Visual Storytelling ( PART 2 )
In our previous exploration of data visualization ( part one of this article ), we dove into the hidden narratives within data, drawing parallels with the mysterious layers of the Mona Lisa’s canvas. Now, we pivot to examine the technological frontiers and transformative potential of visualization techniques, examining how emerging technologies are reshaping our understanding and interaction with complex information. As we venture into this new territory, we’ll discover how innovative approaches can unlock deeper insights and create more immersive, meaningful data experiences.
This journey of innovation and refinement presents its share of challenges. It demands that we venture beyond our usual boundaries, scrutinize our preconceptions, and remain receptive to fresh ideas and viewpoints. Nevertheless, it is through this unwavering commitment to improvement that we can craft visualizations that not only convey information and foster learning but also spark imagination and drive action.
Reflecting on the similarities between the concealed canvas of the Mona Lisa and the realm of data visualization highlights the necessity of delving deeper than the surface. It encourages us to uncover the narratives hidden within our data. Just as the back of the Mona Lisa provides crucial insights into its background and conservation, our data often harbors concealed trends and connections that can only be unveiled through meticulous analysis and creative visualization methods.
The horizon of data visualization is set to be as enchanting as the timeless allure of the Mona Lisa. With technological advancements on the rise, we can expect a new era in how we engage with and extract meaning from information. The progression of data visualization is ready to transform our interaction with data, evolving it from simple representation into a rich, immersive experience.
The evolution of data visualization is happening at an astonishing pace. We are experiencing a shift from static graphics to engaging, interactive stories. These advanced visualizations adapt to user interactions, revealing concealed patterns and insights as time progresses. This transformation is not a future goal; it is currently in motion, propelled by advancements in artificial intelligence, augmented reality, and virtual reality. As these technologies develop further, they are fundamentally changing how we analyze and comprehend intricate datasets.
Augmented reality brings many possibilities to the table by superimposing data visualizations onto the real world. For example, a warehouse manager could wear a smart headset to visualize stock levels and enhance product arrangement in real time. Meanwhile, a city planner could assess various development options by layering anticipated population growth and infrastructure requirements onto a 3D representation of the city.

Virtual reality presents an exciting new landscape for education. Immersing individuals into data-rich settings creates genuinely experiential learning opportunities. For instance, a medical student might find herself examining intricate details of the human body through interactive graphics, receiving a more profound understanding of anatomy and physiology.
The integration of data visualization with artificial intelligence holds the potential to unveil remarkable insights. Machine learning can identify concealed patterns and trends that may escape human analysts. These findings can then be transformed into engaging visuals that convey a clear narrative.
As we adopt these technological innovations, it is crucial to maintain a focus on human judgment. Our aim should be to enhance human understanding rather than replace it. Each data visualization needs have a specific purpose, whether informing decisions, narrating a story, or motivating action.
Having a capacity to enlighten and inspire is where the true strength of data visualization lies. Combining advanced technology with a deep grasp of human perception allows us to produce visuals that are both aesthetically impressive and deeply significant.
Shifting from traditional to modern data visualization techniques may seem challenging, but the rewards can be significant. By adopting fresh approaches, fostering a learning environment, and persistently exploring our data, we can reveal insights that could revolutionize industries, influence policies, and broaden our understanding.

As data increasingly influences decision-making in diverse fields, the significance of data visualizations (and the skills of those who create them) grows substantially. It is crucial that our visualizations are not only technically precise but also fair and inclusive. This means being acutely aware of potential biases that might exist in both data collection and design, and working to represent diverse perspectives authentically.
The impact of data visualization goes far beyond simple display; it serves as a vital means of communication that can significantly enhance comprehension. Just as a talented storyteller clarifies intricate concepts, our data visualizations should not only present information but also encourage exploration and stimulate critical thinking. Essentially, we act as interpreters of complex narratives, converting raw data into engaging visual stories that connect with the human experience.
We face a dual responsibility as our visual tools become more sophisticated. As a result, it’s imperative that we harness technological capabilities while remaining vigilant about potential misuse. Data visualizations can enlighten or mislead, and it’s our duty to promote critical engagement and data literacy. This requires not just technical skill, but a deep ethical commitment to truth and transparency.
The landscape of data visualization goes far beyond technological innovation to encompass ethical stewardship. We are not merely technicians, but cultural interpreters; converting raw numbers into meaningful narratives that can drive understanding, empathy, and positive change. Each visualization represents an opportunity to bridge gaps in comprehension, to make the complex accessible, and to illuminate patterns that might otherwise remain hidden.
In this evolving field, we must cultivate a mindset of continuous learning and intellectual humility. Every dataset holds valuable insights just waiting to be revealed, but finding them demands curiosity, creativity, and a readiness to question our current beliefs. The most innovative visualizations typically come from individuals who can see past traditional thinking, who are willing to challenge accepted stories and investigate alternative viewpoints.
To that point, our data visualizations should have a much higher goal than simply achieving technical elegance. They must resonate on a human level, bridging complex information and genuine understanding. The most powerful data visualizations don’t just inform; they spark imagination, inspire action, and connect people to deeper truths. They transform abstract numbers into human stories, revealing the profound narratives that lie beneath statistical surfaces.
In conclusion, as we look forward, our challenge is to create data visualizations that are simultaneously rigorous and inspiring. We must blend scientific precision with artistic insight, always keeping our primary goal in focus: to make complex information accessible, engaging, and meaningful. This requires a delicate balance of technical expertise, creative vision, and deep empathy for our audience’s unique perspectives and learning styles.
Ultimately, great data visualization is an act of profound communication; that is, it forms a bridge between raw information and human understanding. Embracing innovation, maintaining ethical standards, and staying committed to clarity and compassion will ensure we use data to illuminate the world in all its beautiful complexity. We are not just presenting numbers; we are telling stories, uncovering insights, and creating pathways to deeper knowledge that can transform how we perceive and interact with the world around us. Just as the hidden canvas of the Mona Lisa reveals layers of historical insight beyond its visible surface, our data visualizations should invite continuous exploration, rewarding those who look deeper with rich, multidimensional narratives that echo the masterful complexity of Leonardo’s art.
“Bringing Data to Life and Life to Data”
 About the Author:

Dr. Joe Perez,
Team Lead / Senior Systems Specialist,
NC Department of Health and Human Services
![]()
Dr. Joe Perez ( Dr.Joe ) is also the Chief Technology Officer – CogniMind
To book Dr. Joe Perez for your speaking engagement please click here

Dr. Joe Perez was selected as the 2023 Gartner Peer Community Ambassador of the Year.
Dr. Joe Perez is a truly exceptional professional who has left an indelible mark on the IT, health and human services, and higher education sectors. His journey began in the field of education, where he laid the foundation for his career. With advanced degrees in education and a doctorate that included a double minor in computers and theology, Joe embarked on a path that ultimately led him to the dynamic world of data-driven Information Technology.
In the early 1990s, he transitioned into IT, starting as a Computer Consultant at NC State University. Over the years, his dedication and expertise led to a series of well-deserved promotions, culminating in his role as Business Intelligence Specialist that capped his 25 successful years at NC State. Not one to rest on his laurels, Dr. Perez embarked on a new challenge in the fall of 2017, when he was recruited to take on the role of Senior Business Analyst at the NC Department of Health & Human Services (DHHS). His impressive journey continued with promotions to Senior Systems Analyst and Team Leader, showcasing his versatility and leadership capabilities.
In addition to his full-time responsibilities at DHHS, Joe assumed the role of fractional Chief Technology Officer at a North Carolina corporation in October 2020. A top-ranked published author with over 18,000 followers on LinkedIn and numerous professional certifications, he is a highly sought-after international keynote speaker, a recognized expert in data analytics and visualization, and a specialist in efficiency and process improvement.
Dr. Perez’s contributions have not gone unnoticed. He is a recipient of the IOT Industry Insights 2021 Thought Leader of the Year award and has been acknowledged as a LinkedIn Top Voice in multiple topics. He holds memberships in prestigious Thought Leader communities at Gartner, Coruzant Technologies, DataManagementU, Engatica, the Global AI Hub, and Thinkers360 (where he achieved overall Top 20 Thought Leader 2023 ranking in both Analytics and Big Data). His reach extends to more than twenty countries worldwide, where he impacts thousands through his speaking engagements.
Beyond his professional achievements, Joe’s passion for teaching remains undiminished. Whether as a speaker, workshop facilitator, podcast guest, conference emcee, or team leader, he continually inspires individuals to strive for excellence. He treasures his time with his family and is a gifted musician, singer, pianist, and composer. Joe also dedicates his skills as a speaker, interpreter, and music director to his church’s Hispanic ministry. He manages the publication of a widely recognized monthly military newsletter, The Patriot News, and is deeply committed to his community.
To maintain a balanced life, Perez is a regular at the gym, and he finds relaxation in watching Star Trek reruns. He lives by the philosophy that innovation is the key to progress, and he approaches each day with boundless energy and an unwavering commitment to excellence. His journey is a testament to the remarkable achievements of a truly exceptional individual.
Dr. Joe Perez is Accorded with the following Honors & Awards :
https://www.linkedin.com/in/jw
Dr. Joe Perez is Bestowed with the following Licences,Certifications & Badge:
https://www.linkedin.com/in/jw
https://www.thinkers360.com/tl
Dr.Joe Perez is Voluentering in the following International Industry Associations & Institutions :
https://www.linkedin.com/in/jw
Dr.Joe Perez can be contacted at :
E-mail | LinkedIn | Web | Sessionize | FaceBook | Twitter | YouTube
Also read Dr.Joe Perez‘s earlier articles:


, we dove into the hidden narratives within data, drawing)