Over the Falls without a Paddle : The Perilous Thrill Ride of Ignoring Data Storytelling
Bobby Leach fancied himself a man of daring. In 1911, he climbed into a steel barrel lined with padding, secured himself like a sack of flour, and plunged over Niagara Falls. He survived, albeit with a fractured jaw, smashed kneecaps, and a long stay in the hospital. Years later, after countless lectures and victory laps describing his reckless ride, Leach met his end not at the hands of nature’s fury, but by slipping on an orange peel during a stroll in New Zealand.
 The fall didn’t actually kill Bobby, but here’s my point: There’s something remarkably poetic about this. Leach faced down a natural behemoth and lived. But the very ordinariness of his death is what gets people’s attention. It’s almost Shakespearean: a man who survived the unthinkable taken out by the mundane.
In 2013, Target launched itself into Canada in a fashion that would’ve made Leach proud. A hundred-plus stores opened nearly overnight. People watched, some in admiration, some in awe, and others with concern. There was momentum, media attention, corporate confidence. It looked like a barrel headed for a record-setting splash, if you’ll pardon the pun.
By 2015, it was over. Stores shuttered. Employees laid off. Target Canada was officially out of business. Done. Finished. Kaput.
No catastrophic market collapse. No economic tsunami. Just a series of basic mistakes that no one had the courage (or the clarity) to point out in time. Problems with inventory data, mismatched systems, supply chain snafus, and unrealistic expectations quietly festered. The company that looked fearless in its plunge didn’t fall prey to competition. It, well, slipped on its own orange peel. Again, pardon the pun.
And behind all of this? A massive failure to communicate through data. Not a lack of information, mind you, but a failure to tell the right story to the right people at the right time.
The Launch That Looked Like a Victory Lap
From the outside, Target’s entrance into Canada was textbook. The company moved quickly, acquiring retail spaces and aggressively opening locations from coast to coast. There was fanfare. There were commercials. There was confidence in abundance.
But speed turned out to be the enemy of sense. Their enterprise resource planning (ERP) systems weren’t fully ready. The company tried to build out complex supply chain infrastructure while simultaneously onboarding thousands of employees and managing new vendors. Most of the data that fed purchasing and inventory systems had been entered manually—by interns, no less.
And in the midst of that whirlwind, no one paused long enough to ask whether the numbers made sense.
The Small Mistakes That Became an Avalanche
Here’s the irony: Target had ample data. Mountains of it. But their teams couldn’t align those numbers with the broader business narrative. Product availability in the systems didn’t match what was on the shelves. Distribution centers sent duplicate stock to some stores, while others went empty. Customers arrived expecting the “Target magic” they’d heard about from south of the border. Instead, they found barren aisles and mismatched pricing.
Customer confidence eroded quickly, and the disconnect between expectation and experience proved too great to mend. After being in the Canadian market for less than two years, Target decided to withdraw. The results were stark: 133 stores closed, almost 18,000 employees impacted, and the company incurred a pre-tax loss of $5.4 billion. For a brand known for its precision and refinement, this downfall was both visible and expensive.
This failure cannot simply be attributed to bad luck or outside influences. The real issue that led to this collapse was a failure in the way insights were communicated and framed. Data trickled into different corners of the business, but it never cohered into a story that sparked alignment or foresight. Product shortages, system misfires, and unmet customer expectations—these weren’t unpredictable. They were preventable, had the signals been woven together into a clear narrative.
Just like Bobby Leach’s demise wasn’t from a fruit peel alone. While walking through Auckland, he slipped and broke his leg. The injury led to gangrene, and ultimately, his leg was amputated. Despite surgery, complications ensued, and he died shortly after. The fall didn’t kill him, but the consequences of unaddressed trauma did. In the same way, Target didn’t fall from a lack of ambition, but from failing to read the signs their own data was waving in front of them.
The Story Never Told
What could’ve prevented this?
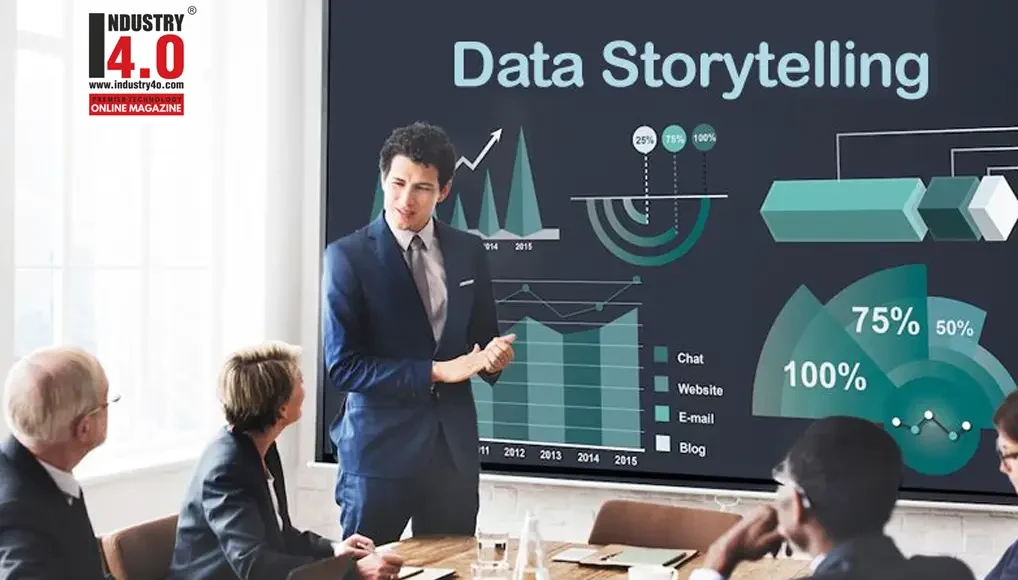
Good data storytelling isn’t some decorative flourish at the end of a deck. It’s the core mechanism that transforms raw figures into actionable understanding. It’s the voice that stands up in a meeting and says, “Here’s what these numbers mean. Here’s why it matters. Here’s what we risk if we ignore it.” It’s the means by which observations become conversations—between functions, across silos, and within leadership ranks. It’s a way of translating uncertainty into navigable terrain.
Organizations often invest in tools that surface performance metrics or trend lines, but rarely in frameworks that ensure those metrics are understood and acted on. The result? A warehouse full of barrels, but no direction on where the river is headed.
Target didn’t suffer from a lack of intelligence. They suffered from a lack of insight translation. And insight that isn’t understood isn’t insight at all.
Storytelling Done Right: What It Looks Like in Practice
Context Is the Current
Before Bobby Leach took his dive, the current had already decided part of his fate. The river above Niagara doesn’t plunge suddenly, but rather, it accelerates in intensity, shaping the descent long before the drop begins. In much the same way, context isn’t a backdrop in data storytelling; it’s the current that determines whether your insights will glide or spiral.
Without context, data points drift aimlessly. Metrics pulled in isolation (like customer foot traffic, product velocity, or market share) may appear self-evident. But without understanding what shaped them (a new competitor, regional holidays, shifting consumer sentiment), those metrics mislead more than they inform.
A strong data storyteller is like a seasoned guide upstream. They see not just where the data is, but where it’s heading, based on surrounding factors. That awareness lets them tell a story that doesn’t merely describe, but anticipates; that is, one that’s built on the nuances of timing, external forces, and system interdependencies.
Empathy Is the Harness
When Leach strapped into his barrel, he didn’t rely on bravado alone; he used a harness, braces, and padding. He understood that survival meant working with the chaos, not pretending it didn’t exist. In the same spirit, empathy is what secures your data story for the audience. It keeps it from becoming a hollow stunt and transforms it into a shared journey.
Too often, data presentations are crafted as if everyone in the room is equally versed in the same metrics or concerns. But CFOs, logistics managers, and regional directors all view the business through different lenses. The story has to meet each group where they are, using terms they trust and framing that fits their priorities.
Empathy also demands clarity over complexity. Rather than simplifying the data, it involves respecting your audience’s time and cognitive load. A cluttered dashboard or a jargon-laden report disengages people before you’ve even reached the point. Empathy guides you to present information in a way that affirms their role in the story and equips them to act.
Tension Drives Action
The moment before Leach went over the brink, I can imagine that there was silence. The crowds were still; watching the barrel edge toward inevitability. That tension gave the spectacle its power. You knew what was coming, but not whether he’d come out of it alive. Guess what? Data storytelling thrives on that same dynamic.
Tension in a business narrative comes not from fear-mongering, but from contrasts: between the expected and the actual; between the current path and its plausible alternatives. Showing that customer churn has risen 15% is useful. But showing that churn is accelerating while satisfaction scores remain static? Now that’s tension. It implies an unknown force at play, and compels decision-makers to ask “why now?” and “what’s next?”
Effective data storytelling doesn’t stop at surfacing risk; it sharpens focus on what’s at stake when key insights go unheeded. When it’s done well, it creates urgency without panic, clarity without oversimplification. It’s the difference between watching a barrel float by and realizing you might be in one yourself!
Lessons from the Splash Zone
If Leach had had a rope tied to that barrel, maybe his ride would’ve been a bit less treacherous. By the same token, if Target had tied their strategy to a more grounded narrative; i.e., one informed by real-time insight and cross-functional alignment, they might still be standing in Canada.
Organizations don’t need more dashboards. They need better storytellers.
Leaders should invest not only in data infrastructure but also in building a culture where insight travels fast, where anomalies trigger conversation, and where every initiative starts with one simple demand: “Tell me the story behind these numbers.”
What ties both stories together is this: vision alone isn’t enough. It’s how insight moves across an organization that determines whether bold actions turn into brilliant outcomes or embarrassing setbacks.
CONCLUSION: Final Word from a Fellow Storyteller
Over the years, it becomes easy to spot the inflection points where a project veers off course; not because the data was wrong, but because the narrative never reached the people who needed it most. Strong organizations unravel because they mistook analysis for understanding.
Don’t be the company that barrels toward glory and trips on its own untied shoelaces.
Learn the craft of data storytelling. Teach it. Champion it. Because what you don’t explain clearly today may be the orange peel that takes you down tomorrow. A good data story needs direction, a harness, and just enough tension to keep its audience awake. But most of all, it needs to be told. Because it’s not the leap that ruins you. It’s the silence that follows when no one hears the story that could have changed the ending.
“Bringing Data to Life and Life to Data”

Dr. Joe Perez,
Team Lead / Senior Systems Specialist,
NC Department of Health and Human Services
Dr. Joe Perez ( Dr.Joe ) is also the Chief Technology Officer – CogniMind
To book Dr. Joe Perez for your speaking engagement please click here
Dr. Joe Perez was selected as the 2023 Gartner Peer Community Ambassador of the Year.
Dr. Joe Perez is a truly exceptional professional who has left an indelible mark on the IT, health and human services, and higher education sectors. His journey began in the field of education, where he laid the foundation for his career. With advanced degrees in education and a doctorate that included a double minor in computers and theology, Joe embarked on a path that ultimately led him to the dynamic world of data-driven Information Technology.
In the early 1990s, he transitioned into IT, starting as a Computer Consultant at NC State University. Over the years, his dedication and expertise led to a series of well-deserved promotions, culminating in his role as Business Intelligence Specialist that capped his 25 successful years at NC State. Not one to rest on his laurels, Dr. Perez embarked on a new challenge in the fall of 2017, when he was recruited to take on the role of Senior Business Analyst at the NC Department of Health & Human Services (DHHS). His impressive journey continued with promotions to Senior Systems Analyst and Team Leader, showcasing his versatility and leadership capabilities.
In addition to his full-time responsibilities at DHHS, Joe assumed the role of fractional Chief Technology Officer at a North Carolina corporation in October 2020. A top-ranked published author with over 18,000 followers on LinkedIn and numerous professional certifications, he is a highly sought-after international keynote speaker, a recognized expert in data analytics and visualization, and a specialist in efficiency and process improvement.
Dr. Perez’s contributions have not gone unnoticed. He is a recipient of the IOT Industry Insights 2021 Thought Leader of the Year award and has been acknowledged as a LinkedIn Top Voice in multiple topics. He holds memberships in prestigious Thought Leader communities at Gartner, Coruzant Technologies, DataManagementU, Engatica, the Global AI Hub, and Thinkers360 (where he achieved overall Top 20 Thought Leader 2023 ranking in both Analytics and Big Data). His reach extends to more than twenty countries worldwide, where he impacts thousands through his speaking engagements.
Beyond his professional achievements, Joe’s passion for teaching remains undiminished. Whether as a speaker, workshop facilitator, podcast guest, conference emcee, or team leader, he continually inspires individuals to strive for excellence. He treasures his time with his family and is a gifted musician, singer, pianist, and composer. Joe also dedicates his skills as a speaker, interpreter, and music director to his church’s Hispanic ministry. He manages the publication of a widely recognized monthly military newsletter, The Patriot News, and is deeply committed to his community.
To maintain a balanced life, Perez is a regular at the gym, and he finds relaxation in watching Star Trek reruns. He lives by the philosophy that innovation is the key to progress, and he approaches each day with boundless energy and an unwavering commitment to excellence. His journey is a testament to the remarkable achievements of a truly exceptional individual.
Dr. Joe Perez is Accorded with the following Honors & Awards :
https://www.linkedin.com/in/jw
Dr. Joe Perez is Bestowed with the following Licences, Certifications & Badge:
https://www.linkedin.com/in/jw
https://www.thinkers360.com/tl
Dr.Joe Perez is Voluentering in the following International Industry Associations & Institutions :
https://www.linkedin.com/in/jw
Dr.Joe Perez can be contacted at :
E-mail | LinkedIn | Web | Sessionize | FaceBook | Twitter | YouTube
Also read Dr.Joe Perez‘s earlier articles:

